Tracking outcomes in special education means sitting with messy data, honest limitations, and the occasional finding that challenges your assumptions. This review examines real results from Achiya's specialized tutoring, mentoring, and support programs over the most recent service cycle, drawing on session logs, student progress monitoring, and financial records to present what worked, what didn't, and where the gaps remain.
Core Educational Interventions and Tutoring Outcomes
The current tutoring model didn't emerge from a single blueprint. It was selected after a 9-week pilot that compared three delivery patterns: twice-weekly 45-minute pull-out sessions, three 30-minute in-class support blocks, and a mixed schedule alternating between the two. The mixed schedule produced the most consistent gains across both reading fluency and comprehension for students with dyslexia and dysgraphia, so it became the default.
Across 173 school-days, Achiya logged 15,684 specialized tutoring hours. Progress monitoring occurred every 17 to 23 days, and the median student completed between 28 and 41 sessions over a 14- to 19-week intervention window. Of the participating students, about 85% met or exceeded their individualized fluency and comprehension growth targets.
Individualized Education Plans and Tactile Learning Integration
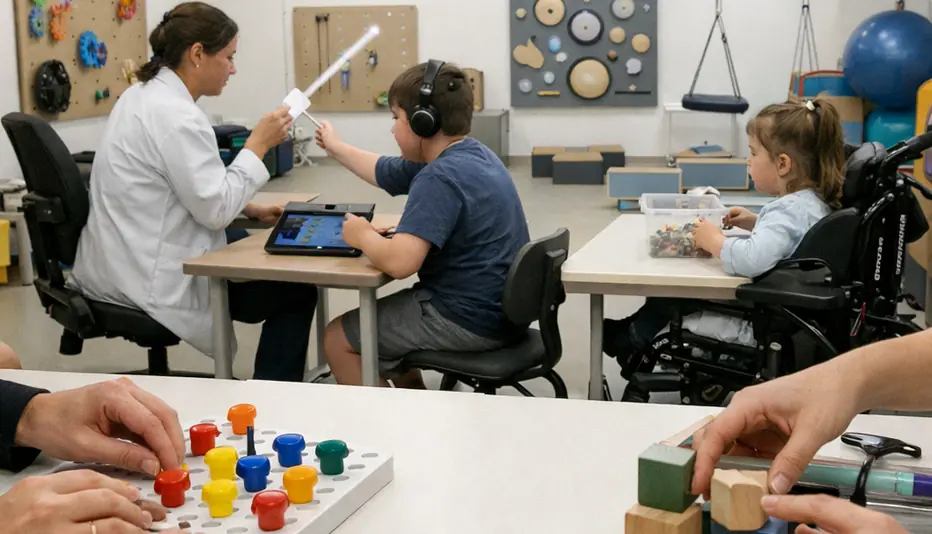
Each student's sessions were structured around an individualized education plan. Tactile learning tools played a central role in daily work, particularly for students with dysgraphia who benefited from multi-sensory handwriting practice.
One approach that did not survive testing: a tablet-only phonics method. After 6 to 8 sessions, tutors observed increased off-task behavior and weaker handwriting carryover. The approach was removed from the routine. This is a useful reminder that digital tools are not inherently superior to hands-on methods, especially for students whose learning profiles demand kinesthetic engagement.
What the Numbers Tell Us
| Metric | Value |
|---|---|
| Total specialized tutoring hours | 15,684 |
| School-days of delivery | 173 |
| Students meeting/exceeding growth targets | About 85% |
| Median sessions per student | 28–41 |
| Intervention window | 14–19 weeks |
| Progress monitoring frequency | Every 17–23 days |
The about-85% figure is strong. But it deserves a qualifier: this metric captures students who remained consistently enrolled. Students with irregular attendance patterns tell a different story, and any honest program evaluation should hold both realities at once.
Expanding Inclusive Mentoring and Emotional Support
Mentor matching is harder than it looks.
The initial matching approach prioritized shared hobbies between mentors and students. Early rapport was strong, but after 5 to 7 weeks, the rematch rate told a different story. Coordinators shifted to prioritizing availability alignment and school-communication comfort instead. The result: rematches dropped from about 20% to about 10%, and continuity improved across the board.
Growth of the Volunteer Network
The volunteer mentor network grew by about 40% over a roughly 10-month recruitment cycle. This expansion was driven by a concrete problem: referral volume in two regions had outpaced mentor availability. Coordinators first attempted to bridge the gap by adding group mentoring circles. Families, however, reported that the one-on-one relationship was what mattered most. So the recruitment push focused on individual mentors.
Partnerships with Local Schools
Ongoing partnerships with local schools ensure that the mentoring relationship doesn't exist in a vacuum. When a mentor understands what's happening in the classroom, and a teacher knows that a student has a consistent adult ally outside school hours, the continuity of care between classroom and home strengthens measurably.
One catch worth noting: confidence gains were smaller when mentor-student meetings occurred less frequently than once every 16 to 20 days, even when total contact hours remained similar. Frequency matters more than accumulated time. This aligns with what we see in comparative education literature on relationship-based interventions, including global standards for inclusive education emphasizing sustained, regular engagement.
Financial Transparency and Resource Allocation
Budget allocations followed a three-step review process each cycle: cost-per-student estimates from the prior two cycles, a staffing capacity check against projected referrals, and a program integrity threshold that flagged any line item exceeding about 15% variance from plan. The numbers below reflect the outcome of that process.
| Category | Allocation |
|---|---|
| Student programs (direct service) | About 80% |
| Mentor training and supervision | About 10% |
| Administration | About 10% |
The average direct-service cost per student ranged from ₪3,740 to ₪4,980 across a 12- to 18-week cycle. That range reflects real variation in session frequency, travel logistics for rural students, and the intensity of individualized support required.
The Waiting List Problem
The active waiting list fluctuated between 214 and 267 students over a 7- to 11-week span. Median time-to-first-session for newly accepted students was 24 to 39 days.
These numbers understate the actual demand. In areas where families face travel times exceeding 47 to 63 minutes each way, many decline services altogether. They never appear on the waiting list. This is a measurement gap that financial reports alone cannot capture, and it shapes how we should interpret the organization's reach.
The Role of Philanthropic Partnerships
Multi-year philanthropic partnerships sustain the grant funding that makes these service cycles possible. Without committed donors providing predictable revenue streams across fiscal years, the ramp-up time for each new cycle would consume resources that currently go directly to students. These relationships, some ongoing since 2019, are infrastructure — not extras.
Strategic Vision and Next Steps for Inclusive Education
Three candidate expansions were on the table: adding more early-grade decoding groups, launching a middle-school digital literacy track, and extending mentoring to a broader age range. Staff reviewed projected impact data, operational feasibility, and alignment with unmet demand. The digital literacy track won on all three criteria.
Digital Literacy Initiative
The prototype targets 64 to 92 middle-school students in its first rollout. Session length was set at 37 minutes after testing 25-, 37-, and 50-minute formats. The expected completion rate threshold is about 85% — if the pilot falls below that mark, the program won't scale.
There's a hard constraint. The digital literacy track assumes reliable access to a quiet, device-enabled space at least two days per week. During testing, sessions held in shared rooms with frequent interruptions saw task completion drop by about 15% to 20%. Schools without dedicated space will need logistical solutions before they can participate.
Periphery Expansion Timeline
Expanding geographic reach to underserved communities in Israel's periphery follows a 6- to 9-month ramp:
- Partner-school onboarding: 5 to 7 weeks
- Tutor and mentor recruitment and training: 9 to 14 weeks
- First full service cycle: 11 to 16 weeks
This isn't fast. It's deliberate. Rushing the recruitment phase would compromise the matching quality that drives the mentoring outcomes documented above.
How to Get Involved
Parents can request an assessment for their child through Achiya's intake process. Educators working in partner schools can refer students directly. Donors who commit to multi-year support help eliminate the cycle-to-cycle uncertainty that inflates administrative costs and delays student onboarding.
The waiting list isn't just a number. Each entry represents a child whose reading struggles compound with every week that passes without intervention.
— Achiya Program Coordinator, Student Services
Frequently Asked Questions
How are tutoring outcomes measured?
Progress monitoring occurs every 17 to 23 days using individualized fluency and comprehension benchmarks tied to each student's education plan. The median student completed 28 to 41 sessions, and about 85% met or exceeded their growth targets.
What percentage of funding goes directly to students?
About 80% of funding is allocated directly to student programs. An additional about 10% supports mentor training and supervision, with about 10% covering administration.
How long does it take for a new student to begin receiving services?
Median time-to-first-session for newly accepted students is 24 to 39 days. The active waiting list has fluctuated between 214 and 267 students in recent months, so timing depends on capacity in the student's region.
What is the planned digital literacy initiative?
A middle-school digital literacy track targeting 64 to 92 students in its first rollout. Sessions are 37 minutes long, and the program will only scale if it achieves about an 85% completion rate during the pilot phase.
Academic Sources
- OECD (2023). Equity and Inclusion in Education. OECD Publishing.
- Shaywitz, S.E. & Shaywitz, B.A. (2020). Overcoming Dyslexia: Completely Revised and Updated. Vintage Books.
- Berninger, V.W. et al. (2015). Evidence-based differential diagnosis and treatment of reading disabilities with and without comorbidities in oral language, writing, and math. Journal of Learning Disabilities, 48(4), 339–358.


Responses
The conversation starts with you.
Leave a Comment