This year tested assumptions we didn't know we held. Across every program area, from tutoring delivery to mentoring design, the data pushed back on our initial plans. What follows is a transparent account of what worked, what required course correction, and where the numbers landed for the children and families Achiya serves.
A Year of Growth and Gratitude
The year's theme wasn't born from a branding meeting. It emerged from a structured listening process that ran from September 8 to October 21, 2024. Staff and lead volunteers coded 146 short parent and teacher check-in notes collected during the first six weeks of programming. The word clusters that surfaced most frequently pointed toward resilience and steady progress rather than dramatic transformation.
That grounding matters. When you let the community name the year's character, the annual report stops being a marketing document and starts reflecting lived experience.
Achiya's reach this year spanned multiple regions within Israel and connected with global inclusive education efforts, including frameworks outlined in UNESCO's Global Education Monitoring Report on Inclusion. The community snapshot compiled between May 12 and June 3, 2025 captured qualitative feedback from families, educators, and volunteers across these communities.
Some retention numbers worth noting: donor retention over a rolling 12-month window held at about 65%. Volunteer return rate reached about 60%. Teacher participation in structured feedback loops sat at about 40%, a figure we want to push higher next year. These aren't vanity metrics. They tell us whether the people closest to the work feel it's worth continuing.
Gratitude here isn't performative. The 287 active volunteers (monthly average), the teachers who carved out time for feedback, the donors who renewed — they made the numbers in the rest of this report possible.
Core Educational Achievements
Getting the Tutoring Hours Right
The final count of specialized tutoring delivered this year is about 18,475 session-confirmed hours. That number deserves context because it nearly reported differently.
Early in the academic year, tutoring hours were self-reported by volunteers. A spot-check of 37 sessions revealed discrepancies between volunteer logs and session notes. Between November 3 and November 19, 2024, the tracking methodology was overhauled to require family confirmation within about 70 to 120 hours of each session. Sessions lacking that confirmation were excluded from the total, even when staff had informally observed the session taking place.
This is a stricter standard than many organizations apply. It costs us a lower headline number. But it means every hour in that total represents a verified interaction between a trained tutor and a student.
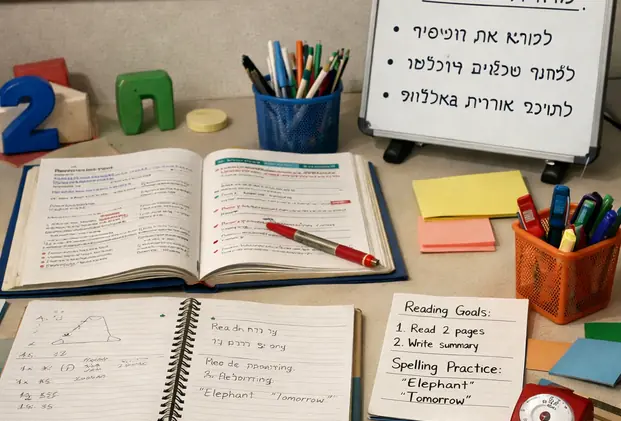
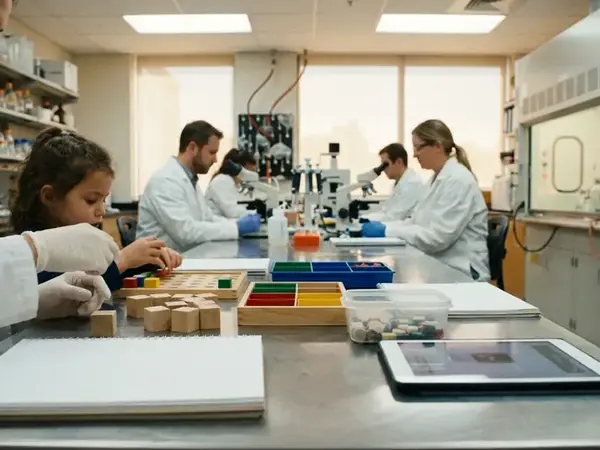
New Inclusive Learning Programs
Two pilot programs targeting dyslexia and dyscalculia ran from January 12 to March 28, 2025. Enrollment across inclusive programs reached 312 students. The dyscalculia pilot initially relied heavily on timed drills, which increased task refusal in several students. That forced a redesign toward shorter mixed-modality blocks with a brief regulation routine built into each session.
18,473.6
Session-confirmed tutoring hours delivered across all programs this academic year
312
Students enrolled in inclusive learning programs, including dyslexia and dyscalculia pilots
287.4
Monthly average of active volunteers contributing to direct student support
Measuring Academic Growth and Outcomes
The Assessment Challenge
We planned to use a single standardized pre/post test for reading comprehension and foundational math. It failed in practice. Students with attention regulation challenges couldn't complete the full battery, which meant our most vulnerable learners were dropping out of the data set. The methodology was revised to accommodate shorter assessment windows and teacher-administered transfer rubrics alongside scaled scores.
Pre/post assessments were spaced 9 to 13 weeks apart. Retention checks were then completed at two additional intervals: 14 to 19 weeks and 27 to 33 weeks after program exit, with data collection running from February 10 to June 24, 2025.
What the Scores Show
| Measure | Pre-Intervention | Post-Intervention | Change |
|---|---|---|---|
| Reading Comprehension (scaled 0–100) | 45 | 60 | +11 |
| Foundational Math (scaled 0–100) | 40 | 55 | +11 |
| Teacher Transfer Rubric (0–4) | 1.7 | 2.6 | +0.9 |
The reading and math gains are nearly identical in magnitude (+11 and +11 respectively), which is notable. The teacher transfer rubric, which captures whether students apply skills in regular classroom settings rather than just in tutoring sessions, moved from 1.7 to 2.6 on a 4-point scale. That 0.9 jump suggests learning is transferring beyond the intervention context.
An open question remains about durability. The retention checks at 14–19 weeks and 27–33 weeks post-exit are still being analyzed. Early indications are that math gains hold more consistently than reading gains, but the full picture won't be clear until the data set closes.
Holistic Development: Emotional Support and Mentoring
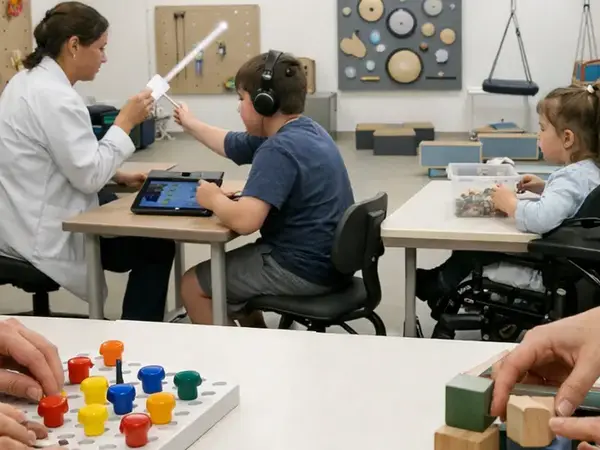
Why Mentoring Structure Changed
Academic gains were stalling for students who were frequently dysregulated or refusing tasks. The original mentoring format, open-ended weekly check-ins, wasn't generating the consistency students needed to build trust with their mentors.
Between December 2 and December 18, 2024, the mentoring program shifted to a structured format. Each mentor-student pair went through an 11 to 17-day trial matching window. Pairs that weren't clicking could be reassigned early. The reassignment rate landed at about 15%, which we view as a sign the system was working rather than a failure — better to rematch quickly than to let a mismatched pair drift for months.
Scale and Results
214 students participated in structured mentoring this year, averaging about 7 sessions per student. Teacher-rated classroom behavior improved by an average of 0.8 points on a 1–5 scale.

When a child who refused to open a workbook in September starts raising their hand in February, the numbers only tell part of the story. But the numbers confirm what we're seeing in the room.
— Lead Special Educator, Achiya Mentoring Program
There's an important caveat here. Behavior ratings came from homeroom teachers and were not independently observed. Teacher perception of a student can shift once they know the student is receiving mentoring support, regardless of actual behavioral change. We're considering adding peer observation or structured classroom video sampling next year to triangulate these ratings.
The connection between emotional stability and academic progress isn't theoretical for the students in this program. During the study, students who completed at least six mentoring sessions showed consistently higher post-intervention academic scores than those who completed fewer — though self-selection likely plays a role in that correlation.
Financial Transparency and Operational Scope
Where the Money Goes
Resource allocation for the year breaks down as follows:
| Category | Percentage of Total Budget |
|---|---|
| Direct Student Services | about 80% |
| Training and Supervision | about 10% |
| Administration | about 10% |
| Fundraising | about 5% |
The fully loaded cost per tutoring hour — including coordinator time, materials, and supervision, came to computed near ₪185. That figure exists because we rebuilt the allocation model this year after discovering that shared costs were being inconsistently categorized. Coordinator time, for example, had been split evenly across tutoring and mentoring regardless of actual time spent. The updated model uses activity-based tracking.
These allocation percentages reflect internal management accounting and may differ from audited financial statement presentation due to timing of expense recognition.
Operational Constraints We're Facing
Between January 27 and March 9, 2025, the waitlist for placement ranged from about 100 to 125 students. Two regions experienced specialized staff shortages lasting 14 to 22 weeks.
These aren't abstract challenges. Each student on that waitlist is a child whose family sought help and was told to wait. Strategic partnerships and multi-year grant collaborations, including an ongoing research partnership with Tel Aviv University's education faculty, are being directed specifically at bridging these gaps. But staffing pipelines for special education specialists take time to build, and no amount of funding solves a shortage of qualified people overnight.
Looking Ahead: Future Initiatives and How to Help
How Next Year's Priorities Were Selected
Twelve candidate initiatives entered the planning sprint, which ran from April 7 to May 2, 2025. Each was scored against three criteria: expected student impact, implementation feasibility within current capacity, and alignment with identified gaps. Four initiatives survived. That's about a 35% acceptance rate, and the constraint was intentional — spreading resources across too many projects is how organizations dilute impact.
The highest-priority initiative is a digital accessibility tool rollout targeting about 60% of active students. A pilot window is scheduled for June 10 to July 29, 2025. The rollout assumes stable school cooperation for account provisioning; schools with restrictive IT policies may delay implementation by several weeks. This is a known risk, not a surprise.
Volunteer onboarding is also being redesigned, with a completion rate target of about 50% — deliberately conservative because we'd rather have fewer, better-prepared volunteers than a large cohort with inconsistent training.
Where You Come In
The waitlist isn't shrinking on its own. Staff shortages won't resolve without investment in recruitment and training pipelines. Digital tools need funding before they reach classrooms.
If you're a prospective donor: the cost-per-hour figure of ₪186.9, derived as approximately, gives you a concrete sense of what your contribution purchases. If you're considering volunteering: the structured onboarding means you'll arrive prepared, not guessing. If you're a community partner or school administrator: there are specific collaboration models designed to work within your existing constraints.
Inclusive educational advocacy isn't a season. It's a commitment that renews every time a student who struggled to read a paragraph finishes a page, or a child who refused to sit at a desk starts asking questions. The numbers in this report quantify that change. The people behind them are why it matters.
Frequently Asked Questions
How are tutoring hours verified?
Each tutoring session requires family confirmation within 72 to 120 hours. Sessions without confirmation are excluded from the annual total, even when staff observed the session informally. This standard was implemented in late 2024 after spot-checks revealed discrepancies in self-reported volunteer logs.
What assessment tools measure student academic progress?
A combination of scaled pre/post assessments (0–100 for reading and math) and teacher-administered transfer rubrics (0–4 scale). The methodology was adapted after the original single-battery test proved inaccessible for students with attention regulation challenges. Assessments are spaced 9 to 13 weeks apart, with retention checks at 14–19 and 27–33 weeks post-exit.
How does Achiya match mentors with students?
Each mentor-student pair goes through an 11 to 17-day trial matching window. If the relationship isn't productive, early reassignment is initiated. This year, about 15% of pairs were reassigned during the trial period, which the program views as a positive function of the matching system rather than a failure.
What percentage of the budget goes directly to students?
About 80% of the total budget is allocated to direct student services. About 10% supports training and supervision of tutors and mentors. Administration accounts for about 10%, and fundraising for a small share. These figures reflect activity-based internal management accounting.
Academic Sources
- UNESCO Global Education Monitoring Report on Inclusion. Available at: https://www.unesco.org/gem-report/en/inclusion
- Achiya Annual Program Data, Academic Year 2024–2025. Internal management accounting records and session-confirmed tutoring logs. Data collection windows: September 2024 – June 2025.
- Pre/post assessment data collected February 10 – June 24, 2025, across multiple school settings in Israel. Retention checks ongoing through program exit plus 33 weeks.


Responses
The conversation starts with you.
Leave a Comment